Maven Data Challenge Winning Project

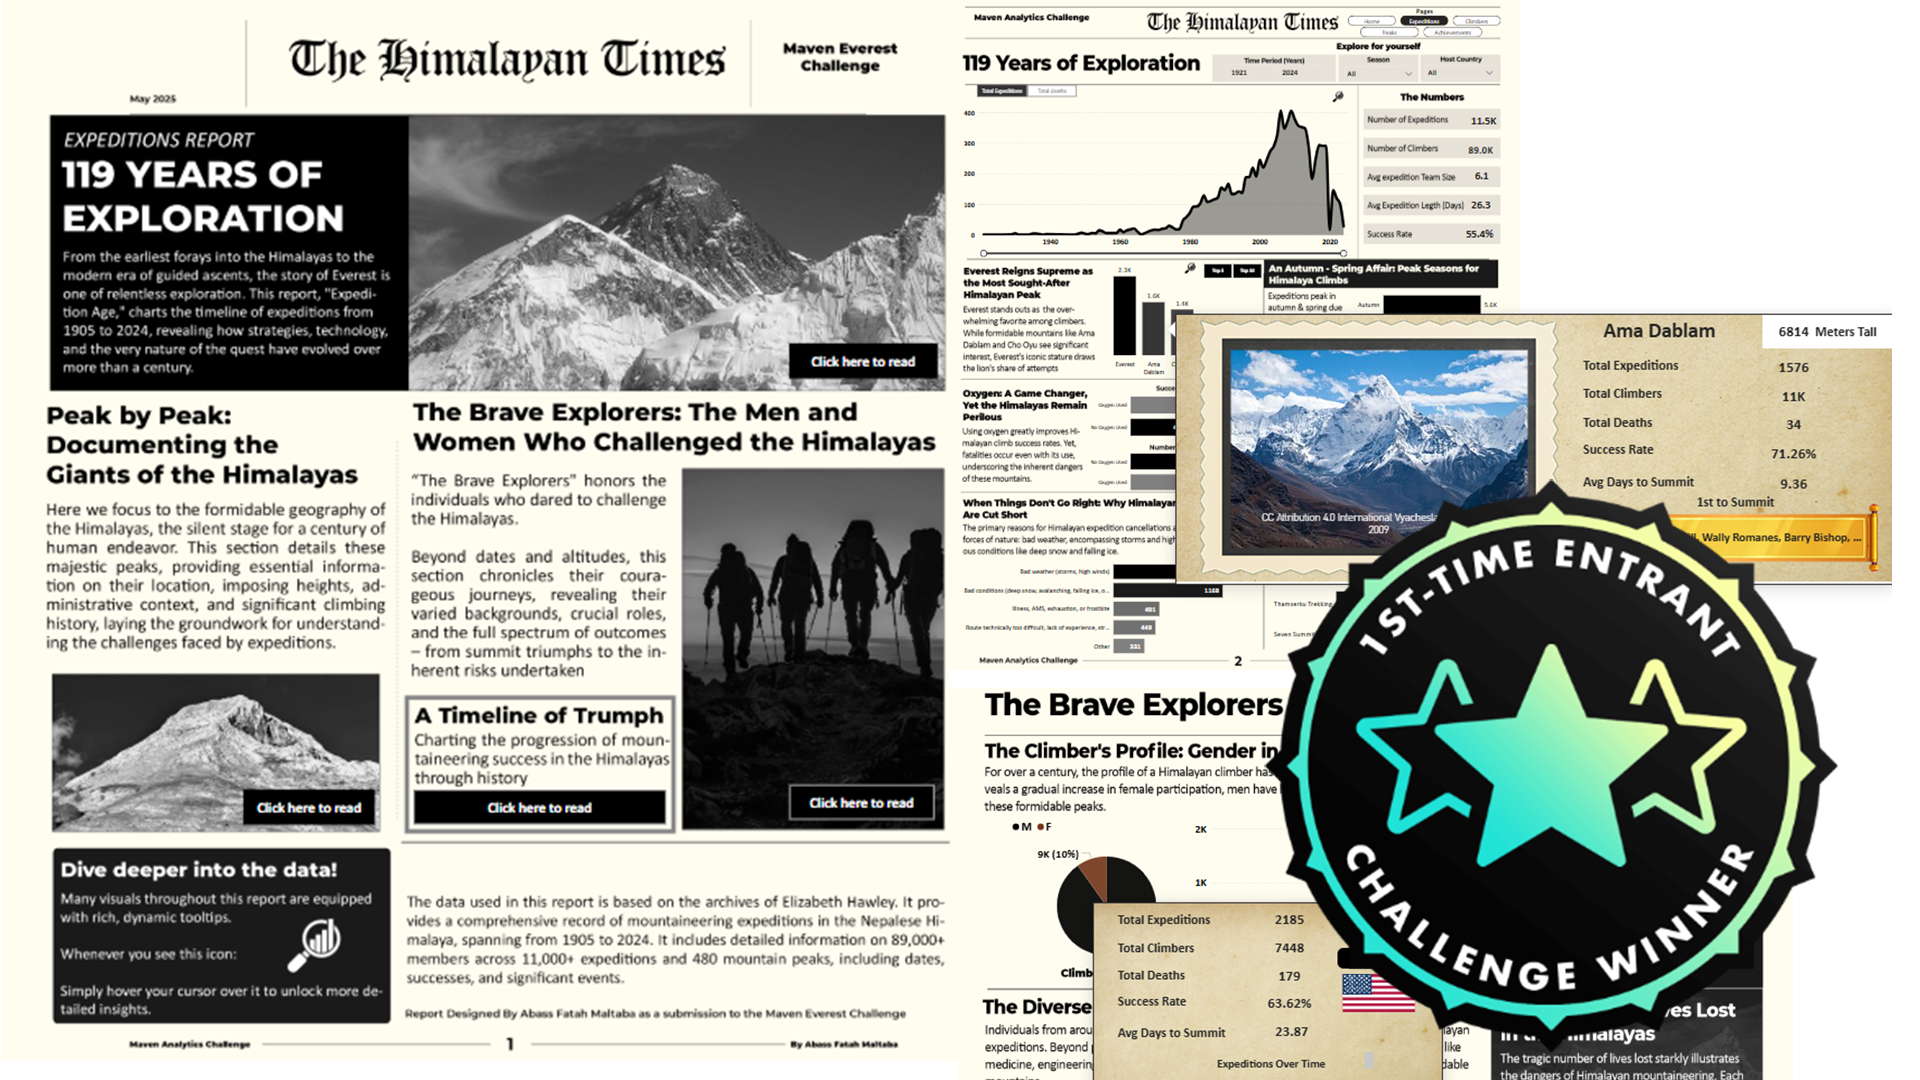
This project, "The Himalayan Times," serves as a comprehensive data visualization project that chronicles over a century of mountaineering expeditions in the Himalayas. My primary objective was to transform the complex historical data into an accessible and engaging narrative, offering valuable insights for mountaineering enthusiasts, researchers, and expedition planners alike.I focused on uncovering and presenting key insights by analyzing various metrics, including:
Expedition Trends: Highlighting the evolution of success rates, team compositions, seasonal patterns, and factors influencing expedition outcomes (e.g., oxygen use, common cancellations).
Climber Demographics: Providing a detailed look at participant profiles, including gender distribution, nationalities, and professional backgrounds, alongside a respectful acknowledgment of fatalities and solo achievements.
The Indispensable Role of Sherpas: Quantifying their critical contributions to expedition success and recognizing the profound sacrifices made within this vital community.
Peak Status and Geography: Illustrating the progress of summits, identifying unclimbed peaks, detailing first ascents, and mapping the complex geographical distribution of mountains, including those shared across international borders. Furthermore, readers can gain a visual appreciation of these magnificent peaks through integrated images accessible via tooltips.
Historical Achievements: Presenting a timeline of notable accomplishments and significant milestones in Himalayan climbing history.The project's "vintage journal" aesthetic was a deliberate choice to enhance user engagement. This design approach creates an immersive, narrative-driven experience, making the exploration of historical data both insightful and captivating, thereby transforming raw numbers into a compelling story of human endeavor and the formidable allure of the Himalayas.Link: Microsoft Power BI
You can access the interactive dashboard by clicking on the link below: